

The Collapse: Timeline & Root Causes
In early 2024, a mid-market apparel chain operating 240 stores began missing four-wall profit targets across a dozen locations. The root cause traced back eighteen months: legacy scheduling software that couldn't align labor coverage to actual traffic patterns. Store managers built schedules from prior-year templates, blind to how foot traffic had shifted post-pandemic. Labor hours and demand diverged, creating pockets of chronic overstaffing during dead periods and understaffing during peak sales windows. This case of workforce planning failures that led to store closures offers critical lessons for multi-location retailers.
By mid-2024, the problem compounded. The retailer's payroll system ran independently from scheduling, so district managers lacked real-time visibility into labor cost percentage until weeks after payroll closed. Corrections came too late. Simultaneously, demand forecasting relied on outdated seasonal curves that failed to predict midweek shopping surges and weekend drop-offs. Stores found themselves perpetually short-handed when customers arrived, leading to abandoned carts and mounting employee frustration.
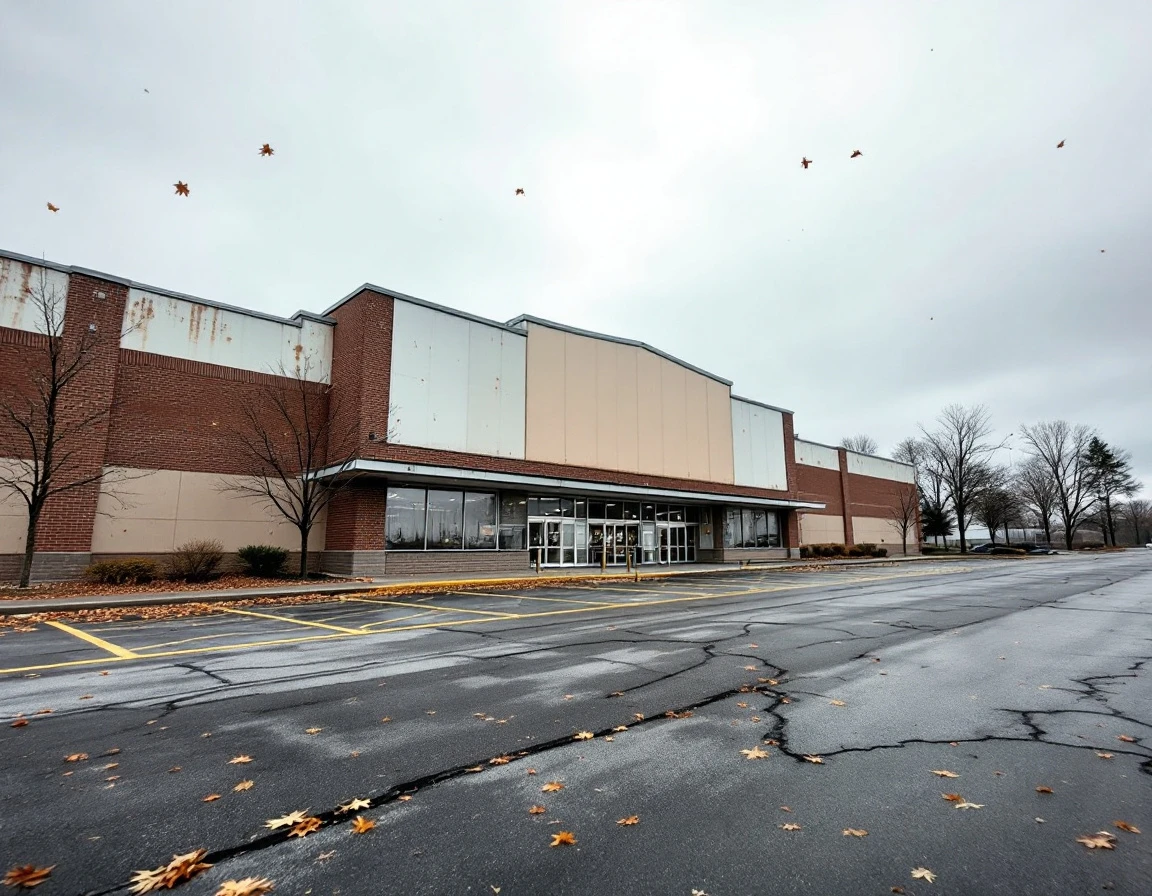
Turnover accelerated through late 2024 and into 2025. Burned-out floor staff left for competitors offering predictable schedules. Replacement costs climbed while institutional knowledge walked out the door. By Q2 2025, thirty-seven stores reported negative four-wall contribution. The chain announced closures in June, citing unsustainable labor economics.
The timeline shows a preventable cascade: scheduling misalignment triggered cost overruns, payroll disconnects blocked corrective action, forecasting errors deepened understaffing, and turnover made operations untenable. Each failure fed the next until the breaking point arrived.
Critical Failure Points: How Labor Planning Breaks Down
Three interlocking failures turned workforce management into an existential threat:
- Scheduling systems operated without demand data. The chain's legacy scheduling platform couldn't ingest point-of-sale trends or traffic patterns, so managers built schedules from historical habit rather than forecasted need. Labor cost variance ballooned when stores scheduled for last year's traffic instead of next week's reality.
- Payroll infrastructure couldn't reconcile scheduled versus actual labor costs. The payroll system sat on a separate platform with no API connection to scheduling, creating cost blindness. Finance teams discovered budget overruns weeks after the labor had been deployed, when payroll closed and the four-wall P&L showed margin erosion already baked in. Schedule-to-actual variance reached double digits in high-turnover locations. This payroll system failure in multi-location retailers remains one of the most common blind spots.
- Forecasting models never touched sales or inventory signals. Corporate planners built labor budgets in spreadsheets divorced from the ERP, merchandise flow, and promotional calendar. Regional directors handed down headcount targets disconnected from store-level execution realities. Store managers had no visibility into how their scheduling decisions tied back to corporate labor budgets, and regional planners had no feedback loop showing whether their forecasts matched the floor. The result: phantom shifts, chronic overstaffing during slow periods, and understaffing when demand spiked, accelerating turnover and eroding both margin and service.

Scheduling System Breakdown
The chain relied on a decade-old scheduling tool that couldn't ingest real-time sales or traffic data. Store managers built rosters from memory and spreadsheets, creating a pattern that rarely matched actual demand. Slow Tuesday afternoons carried the same headcount as Friday evening rushes, while weekends were chronically short-staffed despite predictable volume spikes. These labor scheduling mistakes in retail chains are symptomatic of disconnected systems.
Without a feedback loop connecting schedule to performance, labor cost swung unpredictably from week to week. Employees faced erratic hours — three shifts one week, seven the next — while managers had no visibility into whether shifts aligned with sales-per-labor-hour targets. Turnover climbed, and the remaining crew couldn't cover peak periods, compounding both service failures and margin erosion.
Payroll & Cost Control Collapse
Disconnected payroll infrastructure turned labor cost drift into a silent killer. Without real-time feeds from scheduling systems to payroll dashboards, regional leaders couldn't see which locations were bleeding labor dollars. Scheduled hours sat in one platform while actual payroll posted in another, creating reconciliation gaps that masked overruns for weeks. This scenario reflects broader payroll system failures that plague multi-location retailers lacking integrated infrastructure.
When SPLH and labor cost percentage finally surfaced in monthly reports, stores had already crossed profitability thresholds. By the time finance flagged the variance, negative four-wall contribution was structural, not fixable with mid-period corrections.
Integration & Prevention: Your Audit Checklist
The mid-market apparel chain lacked the infrastructure to catch its workforce failures early. Operations directors and regional planners can prevent the same collapse by auditing five non-negotiable integrations before Q3 2026. Each one traces back to a breakdown that eroded the chain's four-wall P&L.
Five non-negotiable integrations: First, verify your scheduling software connects to demand forecasts. If schedules still originate from last year's template or manager intuition, you're repeating the chain's core mistake. Second, confirm payroll feeds into a real-time labor cost dashboard visible to regional management. Third, forecasting models must update with current sales and inventory signals, not static assumptions. Fourth, store-level visibility for regional planners is non-negotiable. Fifth, build escalation triggers for labor cost variance at a five percent threshold.
First, verify your scheduling software connects to demand forecasts. If schedules still originate from last year's template or manager intuition, you're repeating the chain's core mistake. The system must ingest weekly sales, traffic, and conversion data and translate it into coverage requirements by location and daypart. Second, confirm payroll feeds into a real-time labor cost dashboard visible to regional management. The chain's finance team discovered variance months late because payroll ran in isolation. Third, forecasting models must update with current sales and inventory signals, not static assumptions. The chain's forecasts drifted because they never reflected inventory clearance events or traffic shifts.
Fourth, store-level visibility for regional planners is non-negotiable. If your regional team can't see SPLH, schedule adherence, and labor cost percentage by location daily, they can't intervene before a store turns unprofitable. Fifth, build escalation triggers for labor cost variance. Set the threshold at five percent — any store exceeding target labor cost percentage by that margin for two consecutive weeks requires immediate review.
Red flags demand action: missed forecasts three weeks running, labor cost variance above five percent, annual turnover above twenty-five percent. Each one preceded store closures in the case study. Prioritize the payroll-to-dashboard integration first — cost visibility stops the bleeding. Then close the forecast-to-schedule loop to stabilize coverage and margin together. Request a labor systems audit or schedule a demo to map your current gaps against these five integration points.

From Collapse to Resilience
The apparel chain's collapse isn't just a cautionary tale — it's a blueprint for transformation. Multi-location retailers that treat scheduling, payroll, and forecasting as separate functions inherit the same vulnerabilities that drove this chain to closure. Integrated workforce management is no longer optional; it's the operational foundation that protects four-wall margin and prevents crisis.
A 90-day implementation roadmap provides a path forward:
- Weeks 1-2: Audit current integration gaps using the five critical connection points outlined earlier.
- Weeks 3-4: Prioritize projects that close the highest-risk gaps — typically demand-to-schedule and payroll-to-dashboard links.
- Month 2: Pilot the integrated system in 2-3 locations with different traffic profiles.
- Month 3: Roll out across the chain, using pilot learnings to refine escalation triggers and reporting cadences.
Measure success through three metrics: labor cost variance stabilizing below 3%, forecast accuracy improving to within 5% at the location level, and annual turnover declining as schedules become predictable. These outcomes aren't aspirational — they're the operational markers that distinguish resilient retailers from vulnerable ones.
Request a demo to evaluate your current integration gaps before Q3 2026.