

The Collapse Pattern: Restaurant Chain Labor Scheduling Failure
A regional dining chain operating in the Southeast shuttered 27 locations within 18 months—not because of menu fatigue or marketing missteps, but because restaurant chain labor scheduling failure set off a cascade that made recovery impossible. The timeline is instructive: the first signals appeared in mid-2023, when forecast accuracy dropped below acceptable thresholds and coverage gaps began appearing during peak hours. Overtime spiked as managers scrambled to fill shifts, pushing labor cost to 38% of revenue at underperforming locations.
Within six months, the operational strain surfaced as staff turnover—45% annualized at the worst-performing stores—and service degradation followed. Customers noticed longer wait times and inconsistent quality. By the time financial collapse became unavoidable in early 2024, the chain had lost both its workforce and its reputation across a multi-location network.
This pattern mirrors documented failures in franchise retail dining: scheduling breakdowns precede financial crisis by six to eight months, and the dysfunction spreads faster across connected locations than isolated problems ever could.
The forensic lesson is clear—labor planning failures, not product or positioning, drive closuresThis insight is reinforced by documented evidence: labor planning failures, not product or positioning, drive closures.
Five Scheduling Dysfunction Patterns That Drive Multi-Location Restaurant Closure Causes
The chain collapse traced above stemmed from five repeating scheduling failures:
- Forecast disconnection
- Labor-target misalignment
- Coverage gaps
- Reactionary overstaffing
- Shift-fairness breakdowns
Each pattern amplifies the others, creating cascade failures across locations.
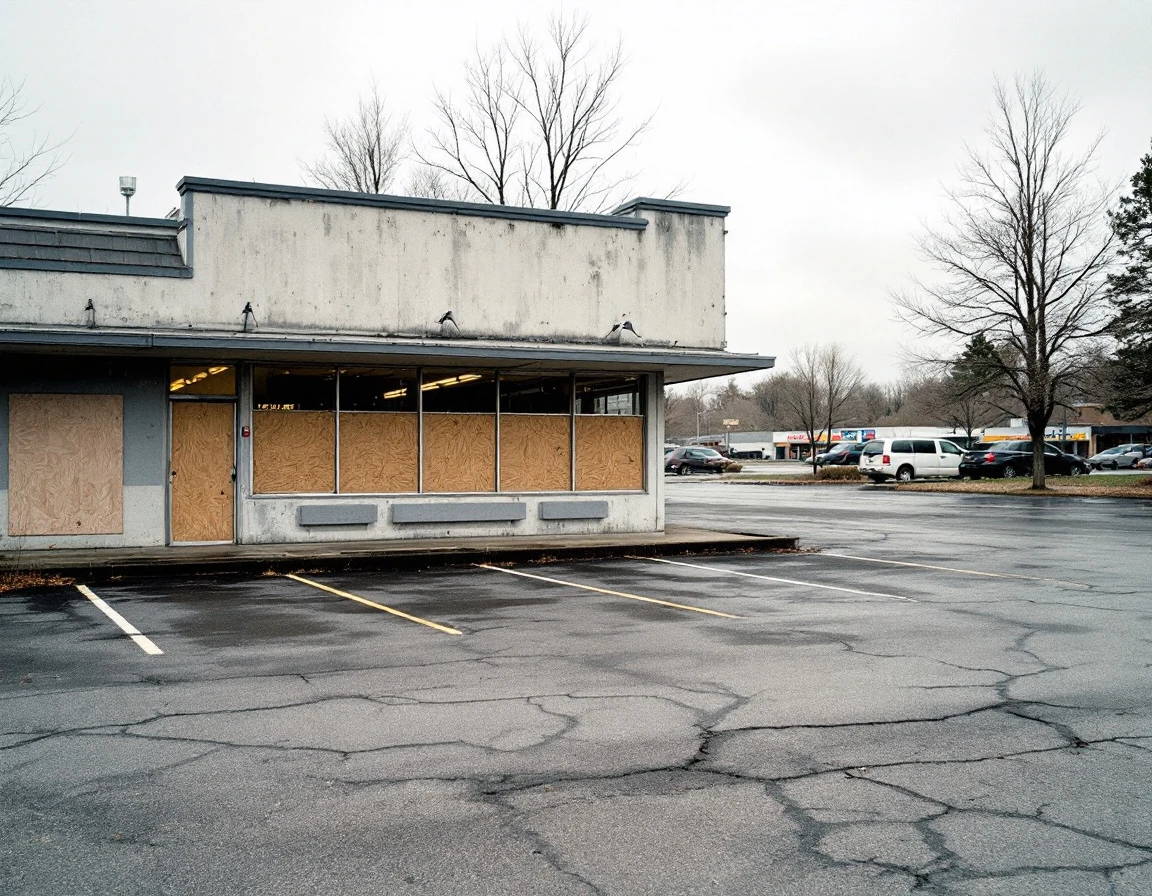
Forecast blindness: sales predictions diverge
The first break in the chain occurred at the forecast layer. Sales predictions consistently missed actual transaction volume by more than 20 percent, especially during lunch rushes and weather-sensitive dayparts. When forecasts underestimate demand, the labor plan built on top of them leaves floors understaffed during the exact hours that drive revenue.
Those coverage gaps appeared most acutely during peak periods and weather volatility—rainy weekends, unseasonably warm evenings—when traffic spiked but the schedule reflected outdated assumptions. Managers filled the gaps with overtime, creating a second-order problem: labor cost inflation from chronic understaffing. Overtime premiums compounded week after week, eroding four-wall margin faster than the P&L could absorb.
Part-time availability chaos: unscheduled
Unscheduled absences and last-minute availability changes create cascading coverage failures that no manager can solve in real time. Part-time staff working across multiple employers pull shifts without notice, leaving gaps that force full-time leads into unplanned overtime or drive managers to close stations entirely. This churn compounds when there's no system to track which locations are bleeding coverage week after week—operations directors flying blind can't identify the stores where availability patterns are breaking down until the P&L already reflects the damage.
How Labor Planning Inefficiencies Retail Dining Failures Compound Across Locations
A single restaurant with forecast errors and coverage gaps can survive if the general manager watches the schedule closely, makes manual adjustments each week, and knows the team well enough to plug holes before they become crises. The labor cost may drift higher than plan, and turnover may tick up, but local knowledge acts as a buffer against catastrophic failure.
A 27-unit chain with disconnected scheduling systems at each location loses that safety net. Headquarters cannot see which units are running at 28 percent labor cost and which have drifted to 35 percent. The blended network average masks the variance, and the aggregate signal becomes noise. Operations leaders have no early-warning system to flag which stores are burning through managers, which are leaning on permanent overtime to cover stations, or which are one sick day away from a dining-room closure.
This invisibility prevents intervention before local dysfunction spreads. High-turnover locations begin pulling staff from neighboring units, draining talent across the network. Coverage gaps at one store force last-minute schedule changes at another, compounding availability volatility. Without unified labor-planning visibility, each location's scheduling breakdown accelerates the others. Turning isolated pain into systemic collapse.
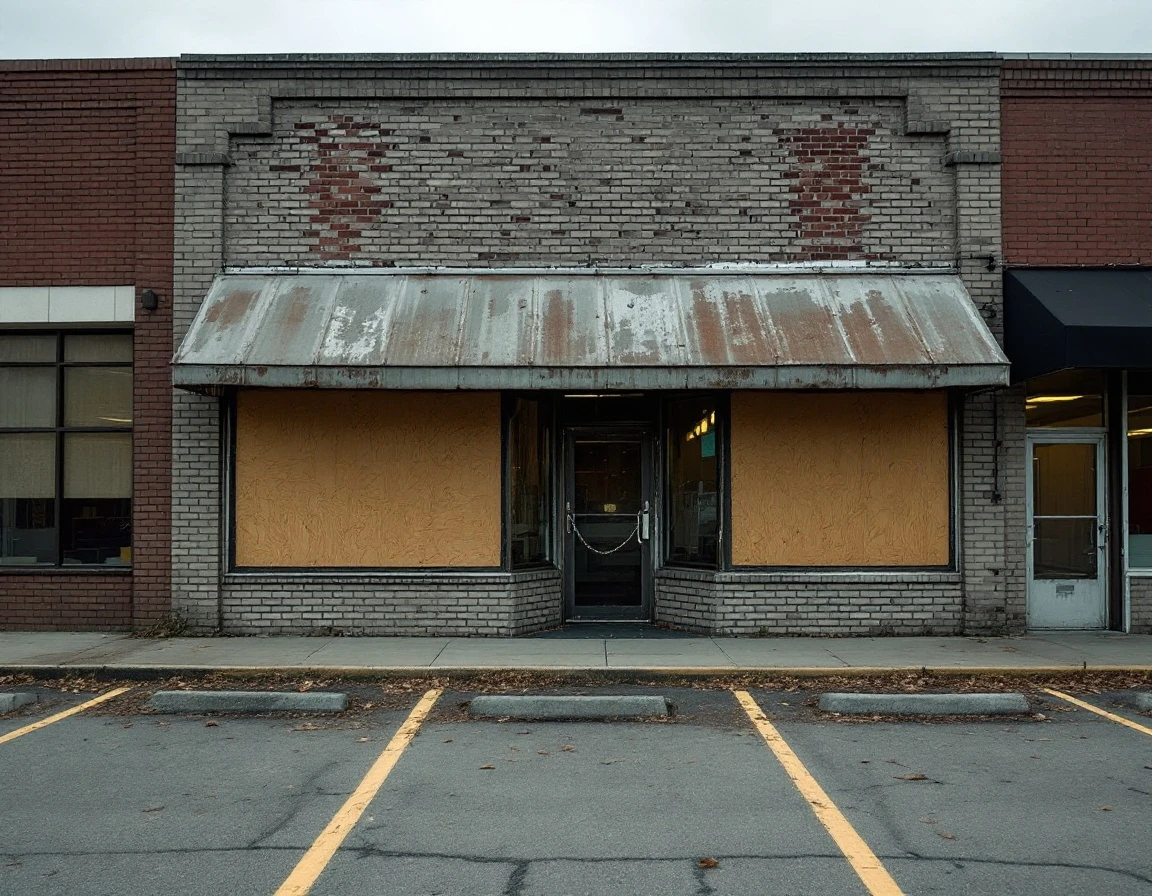
The July Scheduling Audit Checklist
Operations managers waiting for August peak volume to reveal scheduling dysfunction will arrive too late. The time to diagnose system health is now, before summer traffic arrives and pressure-tests every weak link in your labor plan. Run this five-point audit immediately to identify if you are tracking toward the collapse patterns documented above.
Check 1 — Forecast Accuracy
Pull sales data and labor schedules from the past eight weeks for each location. Calculate the variance between forecast and actual sales. If variance exceeds 20 percent at any location, that unit is scheduling blind. Forecast disconnection is the root failure that cascades into every other dysfunction.
Check 2 — Coverage Gap Scan
Flag any location with more than three short shifts in the past month—instances where stations went unstaffed or managers worked the line because the schedule failed. Coverage gaps signal availability volatility or forecast failure that will compound under heavier traffic.
Check 3 — Labor Cost Drift
Identify locations where labor cost as a percentage of sales exceeds your regional benchmark by more than two percentage points. Cost drift indicates reactionary overstaffing, overtime accumulation, or target misalignment that erodes four-wall margin.
Check 4 — Turnover Cluster Mapping
Map turnover rates across locations to identify early warning zones. Clusters of improved turnover expose shift-fairness breakdowns or chronic understaffing that hasn't yet surfaced as a coverage crisis.
Check 5 — System Visibility
Test whether you can answer this question in under ten minutes: which locations ran overtime last week and why? If the answer requires calls to individual managers, you lack centralized visibility and cannot detect spreading failures before they become systemic.

July Implementation: Closing the Gap
If your audit surfaced red flags—forecast errors beyond twenty percent, coverage gaps that trigger weekly overtime, or turnover clusters in three or more stores—you have a narrow window to fix the problem before August peak season arrives. The two to four weeks between mid-July and back-to-school demand surge represent your last chance to lock in labor planning changes before volume spikes expose every weakness in your scheduling system.
Start with the locations that failed the forecast accuracy check. These stores are already operating blind, which means every peak shift becomes a crisis and every staff shortage compounds labor cost.
Set weekly labor cost targets by location for August, calibrated to expected sales volume and the four-wall P&L those stores need to defend during the highest-traffic weeks of the year.
Implement a cross-location visibility dashboard for July onward so headquarters can track labor cost variance, coverage gaps, and turnover signals across the network in real time. Establish an escalation protocol. Which metrics—sustained forecast error, repeated station closures, or abnormal labor cost drift—trigger direct intervention from operations leadership before a local problem becomes a network crisis.
See how PlannerPuffin turns sales forecasts into labor plans that protect your four-wall margin and prevent the collapse patterns documented in this case study.